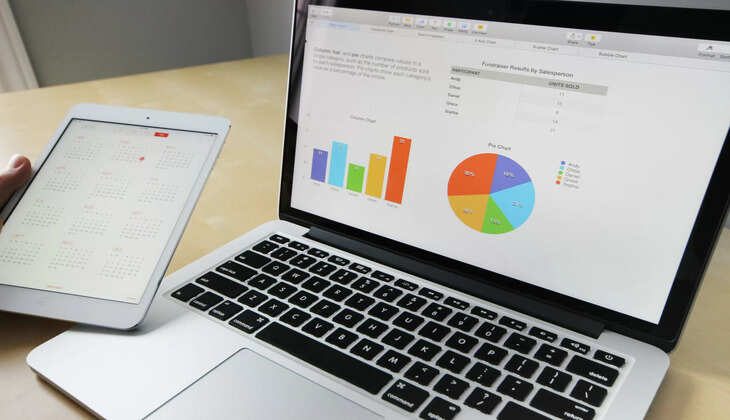
What Is Data Analysis??

Data analysis is the process of examining, cleaning, transforming, and interpreting data to uncover meaningful insights, trends, patterns, and relationships. It involves systematically analyzing data sets using statistical, mathematical, and computational techniques to extract valuable information and make informed decisions.
Here are the key steps involved in data analysis:
-
Data Collection: The first step in data analysis is collecting relevant data from various sources, such as databases, spreadsheets, surveys, sensors, or web applications. The data can be structured (organized in a predefined format) or unstructured (not organized in a predefined format).
-
Data Cleaning: Once the data is collected, it needs to be cleaned to remove errors, inconsistencies, missing values, and irrelevant information. Data cleaning involves tasks such as removing duplicates, correcting typos, standardizing formats, and handling outliers.
-
Data Exploration: After cleaning the data, analysts explore and visualize it to gain a better understanding of its characteristics, distributions, and relationships. Data exploration techniques include summary statistics, histograms, scatter plots, and correlation matrices.
-
Data Transformation: Data may need to be transformed or manipulated to prepare it for analysis. This can involve tasks such as aggregating, filtering, sorting, or encoding data to facilitate analysis and modeling.
-
Statistical Analysis: Statistical analysis involves applying statistical techniques to analyze the data and uncover patterns or relationships. Common statistical methods include hypothesis testing, regression analysis, clustering, and classification.
-
Data Interpretation: Once the analysis is complete, analysts interpret the findings and draw conclusions based on the insights gained from the data. This may involve identifying trends, making predictions, or answering specific research questions.
-
Data Visualization: Data visualization is an important aspect of data analysis, as it helps communicate complex findings in a clear and intuitive manner. Visualizations such as charts, graphs, and dashboards are used to present the results of the analysis effectively.
-
Reporting and Presentation: Finally, analysts prepare reports or presentations summarizing the findings of the data analysis and communicate them to stakeholders, decision-makers, or other relevant audiences. The reports may include key insights, recommendations, and actionable next steps based on the analysis.
Overall, data analysis plays a crucial role in extracting valuable insights from data to support decision-making, problem-solving, and strategic planning in various fields such as business, finance, healthcare, marketing, and scientific research.
